
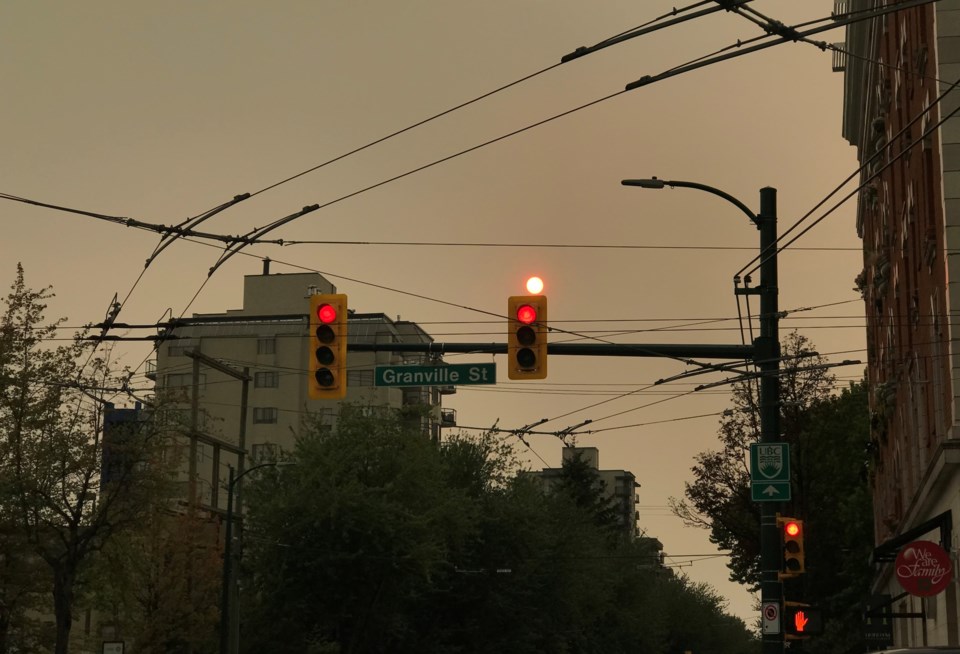
On Sept. 11, Vancouver held the grim distinction of having the worst air quality in the world. Spurred on by wildfires in and around B.C., Vancouverites choked from smoke-filled skies for two days. Not for the first time either, as poor air quality has become the norm for Vancouver summers.
But just what is in all of that foul air? And how do we measure it? And can we mitigate smoky air?
You have no doubt heard a weather forecaster mention the Air Quality Index (AQI). AQI is a measurement of air quality against strict air quality standards and environmental guidelines, and factors in the effects pollution has on both the environment and humans. Through these measurements, we can see how we are doing in upholding various air quality standards. Now, this is not to be confused with the Air Quality Health Index (AQHI), which measures the risks of specific air pollutants to our overall health: ground-level ozone, nitrogen dioxide, and particulate matter.
The key difference between the two indices is that the AQHI gives a better indication of the threat air pollution poses to us on a given day.
Mapping the Air Quality Health Index for Metro Vancouver
Metro Vancouver uses something called Air Map, an AQHI scale that ranges from 0 to 10+, or Low to Very High. The lower the number, the less polluted the air is; and high numbers mean the poorest air conditions have been exceeded. As these numbers go up, so do any associated health advisories. (At their extreme, an advisory may be to stay enclosed indoors until things improve.)
Air Map cuts Metro Vancouver into six regions: Metro NW, NE, SW and SE; Central Fraser Valley; and Eastern Fraser Valley. You can click anywhere on this Air Map to see an updated (by the hour) reflection of each area’s current air pollution levels.
For example, at the time of this writing, Metro Vancouver's SW, SE, and NW ratings are a Low at 3, whereas the NE peaked at 5, or medium. So someone leaving Richmond to visit Maple Ridge today would notice a slight, but significant change in the air quality. If that individual has respiratory issues, they would notice this change more so than someone else.
Two of the specific pollutants measured cause all sorts of havoc to our health.
What is it in smoky or "bad quality" air that harms our health?
Particulate matter (PM 2.5.), is very fine particles or droplets in the air resulting from car exhaust, industrial emissions, dust, wood stoves and wildfires. As climate change leads to more intense wildfires, increased rates of PM 2.5 in the air could see more respiratory and cardiovascular system issues among the population.
Ground-level ozone is a naturally-occurring gas which forms when other organic compounds react with sunlight. Though less severe than PM 2.5, it still causes health problems like bronchitis, asthma, and emphysema. Unlike fossil fuel emissions, which can be curtailed, ground-level ozone is something that can not. If winters get warmer and summers get longer, any increased ozone pollution will play a persistent role in AQHI measurements, and it likely won’t be good.
Beyond mere data collection, the AQHI helps in another way: awareness. Through awareness, there are openings for accountability. With a better understanding of the links between climate change, air pollution, and their health, folks can be more proactive in limiting their exposure to bad air. Heeding advisories in extreme cases or taking greater personal care in moderate-ranked air could mean the difference between a mild cough and a more serious health outcome. Wearing masks outdoors, keeping home windows and doors shut, switching from firewood to propane heating, or buying an electric vehicle, are all changes that can be made at the individual level.
Put another way: the Air Quality Health Index is a report card on how we have polluted our own air. It measures just how comfortable we are with our own health at risk to toxic air. And if AQHI mitigates nothing else, may it mitigate apathy.


