At my office job, we’ve been talking about lead and lag measures lately, as a way of telling when we are successful at accomplishing our goals and whether we are improving as a department. It’s a whole lot of basic business management and leadership stuff, but it’s got me thinking about how they apply to hockey.
A lag measure is directly related to your end goal: it’s something you can influence, but it comes after an activity is completed. In hockey terms, think wins. A win is recorded after the fact and it tells you whether you were successful, but it doesn’t give you much information about how to improve in the future.
Goalscoring is also a lag measure. It’s recorded after the activity is done and it can’t be changed. And again, goal differential tells you whether you were successful, and it’s more useful for predicting future success, but it doesn’t tell you how you got there.
A lead measure, on the other hand, is something you can measure that influences the lag measure. In other words, what can you do to influence goal differential and therefore wins? A lag measure is hard to directly influence, but lead measures are within your control.
The trick is to find which lead measures have the biggest impact on the lag measures. What measurable thing can a hockey team do that has the biggest influence on goal differential?
This is where analytics types might bring up corsi: it’s measurable and it has a predictive influence on goal differential. But I would argue that corsi is also a lag measure. It’s indicative of whether a team is succeeding at their goals, but simply measuring shot attempt differential doesn’t tell us what the team can do to get better. It comes after the fact. It’s useful, sure, but it doesn’t tell us what we want to know.
If analytics stops with corsi, then it can really only tell us that a team is doing well, not what a team is doing well.
Fortunately, there are all sorts of people out there pushing hockey analytics into new and exciting directions. An example would be the work of Eric Tulsky and Corey Sznajder with zone entries. Gaining the offensive zone with possession has a direct impact on corsi and therefore goal differential and therefore wins. Controlled entries could be a lead measure that a team tracks to see whether their system is effective.
Another is the work of the Passing Project and, again, Corey Sznajder, which is where I’ll turn this towards applying it to the Canucks.
Many people have attempted to crack the shot quality problem. Watching hockey, we all intuitively know that some shot attempts are more dangerous than others, but it’s been hard to isolate that analytically, leading to shot quantity statistics — corsi and fenwick — to be more useful.
A lot of the attempts to figure out shot quality have centred around shot location, which makes sense. A shot from the “home plate area” in front of the net is intuitively more dangerous than a shot from the point or at a bad angle from the boards.
But what makes a shot more likely to go in often has a lot more to do with what happened just prior to the shot being taken. If you’ve watched the Canucks for the last decade, this should make perfect sense: it’s not just that the Sedins set up scoring chances in front of the net for their various linemates, it’s that they frequently set them up with tap-in goals.
The Passing Project and Corey Sznajder have done an incredible job of tracking passes that lead to shots, giving rise to new statistics like shot assists. For the moment, I want to focus on what they call Dangerous Passing Plays.
The most dangerous passes, ie. the ones that create the most dangerous shot attempts, come in two flavours: across the royal road and from below the goal line. The royal road is essentially the slot: it extends from the front of the net between the two faceoff circles. A shot after a pass going across the royal road is ten times more likely to go in.
A pass from below the goal line is nearly as dangerous. Put those two together and you have a lead measure that teams can track that will result in more success. If your offensive systems can create more passes across the royal road or setups from below the goal line, you’re going to get more goals.
This also has an application defensively. Ryan Stinson has been working with passing data to identify styles of play: how do teams create and prevent goals? He created a fun visualization of this with Tableau, with which I created the below image.
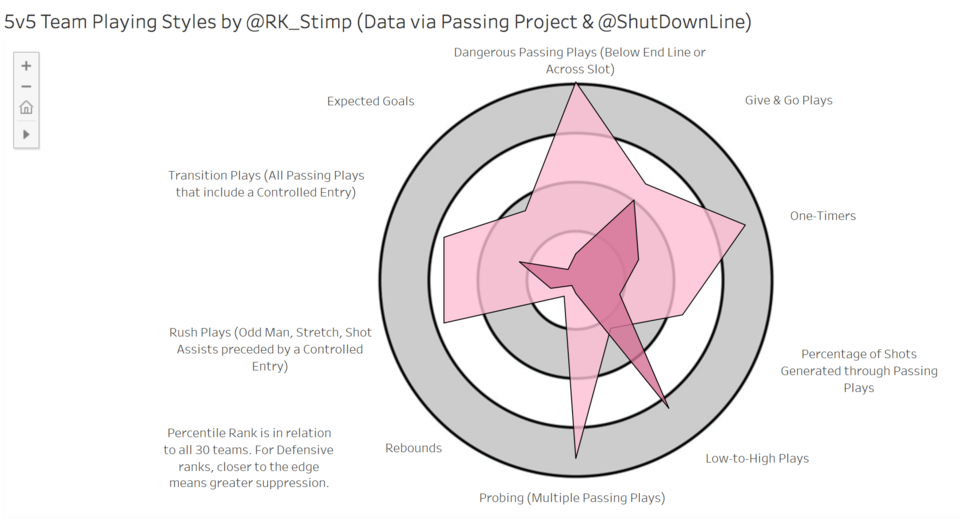
That’s the Canucks’ offence and defence laid over each other. The offence is the pale pink and the defence is the dark pink. The data comes from 44 games over the past two seasons.
Offensively, there are actually some positive signs for the Canucks, though they have some clear deficiencies. They are terrible at creating rebound opportunities, for instance, and an overall low percentage of their offence comes from passing plays. When it does come from passing, however, they create a lot of dangerous passing plays. I’ll be breaking this down in some future posts, but much of this is still driven by the Sedin line, though Bo Horvat took strides last season.
Defensively, though, the Canucks are awful.
Not only did the Canucks allow a lot of shots over the past two seasons, they were also woeful at preventing the type of passing plays that make those shots dangerous. Stinson put the Canucks in the category of “Woof” because, like Kevin McCallister seeing a picture of Buzz’s girlfriend, that’s the only reaction he could muster.
About the only passing play the Canucks were good at preventing was the low-to-high play, but that may only be because teams didn’t have to use that play against them with all of the other open passing lanes down low.
The Canucks complete inability to prevent passes across the royal road and from below the goal line puts extra pressure on their goaltending, so is it any wonder they also gave up a lot of shots off rebounds?
It seems like this can’t just be personnel-driven: the Canucks definitely don’t have the best defensive corps, but being this bad at preventing passing plays has to be driven by systems. This data suggests a clear area for improvement for the Canucks’ new coaching staff: can they put into place systems that prevent dangerous passing plays?
If they can, the Canucks will be in much better shape defensively next season.