
The hot weather dominating much of British Columbia this fall was made roughly twice as likely due to climate change.
That’s according to the Climate Shift Index (CSI), a rapid attribution tool produced by the U.S.-based Climate Central research group. Previously, the CSI only showed climate change's real-time fingerprints on communities in the United States. But that changed last month when it expanded to cover more than 1,000 cities across the world.
“It is credible,” said Nathan Gillett, who as a research scientist at the Canadian Centre for Climate Modelling and Analysis (CCCma), was not involved in producing the tool.
“I think it’s kind of nice. For any day and any location, you can see how climate change has changed the odds… [it’s] helping people understand climate change, and you know, what it means to them.”
Climate attribution science isn't new, but speed and accuracy have rapidly improved in recent years, moving in lock-step with better real-time data and more powerful computer models.
Within days of the record-breaking heat wave that killed at least 619 people in B.C. in the summer of 2021, Gillett and other experts linked through the World Weather Attribution initiative found the event would have been “virtually impossible” without human-caused climate change.
This year, another study from the group found climate change made drought in North America five to 20 times more likely in 2022 compared to the beginning of the 20th century.
Gillett's work often focuses on long-term shifts in the planet's climate. Based out of the University of Victoria, he is part of the CCCma research group developing Canada's main climate model, both to simulate the past and to predict the future. But he also says rapidly attributing a single weather event to climate change has at least two major benefits.
“If we can say that the odds of this kind of event were increased by 50 per cent, then it helps people understand how climate change is already impacting them directly,” said the Environment and Climate Change Canada research scientist.
Perhaps more importantly, added Gillett, rapid attribution allows people and policymakers to quickly understand the cost of extreme weather events and what it will take to adapt to what’s coming.
“It’s important if we're, for example, rebuilding a bridge that was washed out by the floods. You know, how much stronger do we need to make it?” he said.
Climate Central’s CSI tool takes that real-time attribution science to the next level, providing daily updates on how much human-caused climate change has influenced weather on any given day anywhere on the planet.
How the CSI scale works
To take climate change's real-time fingerprint, CSI uses a peer-reviewed process that compares observed temperature data with models that estimate how the weather would behave with and without human-caused climate change.
In addition to the 1,000-plus cities across the world, the group produces heat maps indicating climate's fingerprint on a sliding scale from -5 to +5.
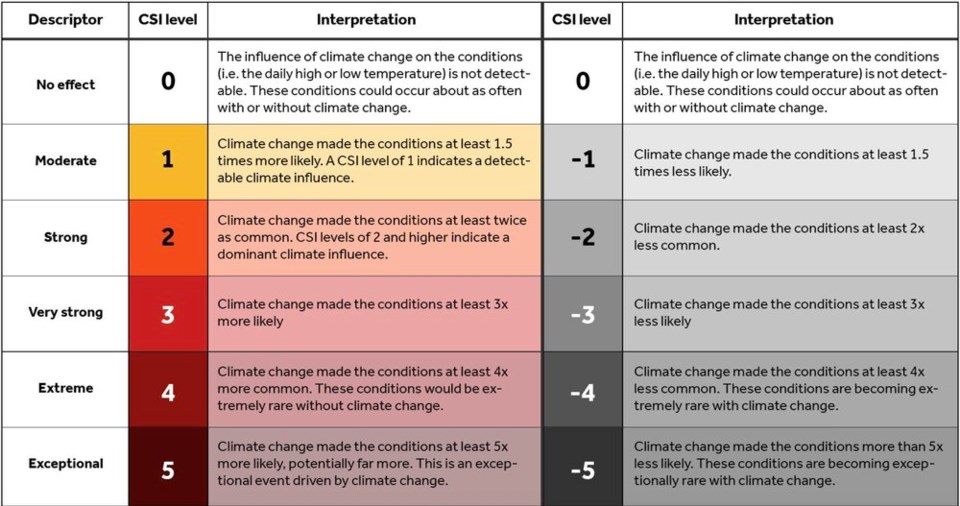
At zero, the influence of climate change on weather conditions, such as a daily high or low temperature, is not detectable. At this point on the scale, the prevailing weather is as likely to proceed with or without the effects of climate change.
A CSI of +1 indicates climate change has made weather 1.5 times as likely; at +2, a strong effect from climate change has made weather twice as likely; at +3, a very strong climate fingerprint has made the prevailing weather three times as likely; and at +4, weather conditions have been made four times as likely, or “extremely rare without climate change.”
At +5, an “exceptional” climate change signal indicates weather conditions have been made at least five times more likely, “potentially far more,” states Climate Central’s CSI scale.
At the other end of the scale, CSI levels -1 to -5 indicate climate change has made prevailing weather conditions increasingly rare — think a seasonably cool day set to become increasingly scarce into the future.
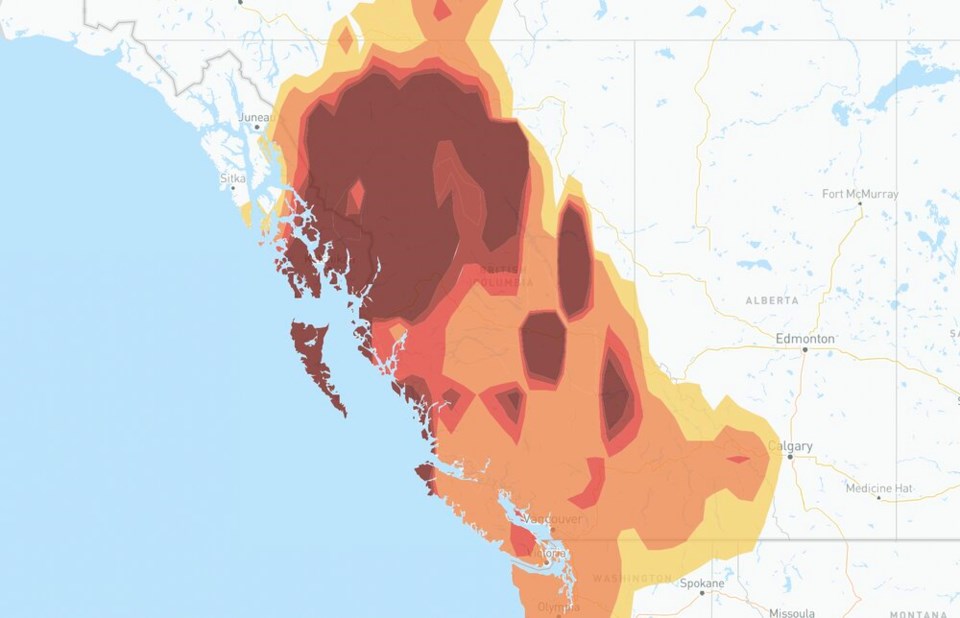
Over the first three weeks of October, the weather in large swathes of B.C. was regularly dominated by CSIs of +2 to +5.
The CSI averaged about 1.75 over the entire region, peaking on Oct. 19, according to Daniel Gilford, one of the group’s climate scientists.
That means that on average the hot conditions experienced by people all over B.C. were made nearly twice as likely because of human-caused climate change.
“This is a pretty strong climate change signal,” he said in an email, “especially in that it persisted over a [roughly] 2-week stretch over the whole of British Columbia!”
The arrival of a handful of low-pressure systems around Oct. 20 dialed back the CSI climate signal to neutral for two or three days.
Some regions of the province, like Haida Gwaii and parts of northern B.C. have continued to have their warm temperatures dominated by climate change at a moderate to exceptional level, according to the CSI.
That is, until Oct. 31, when negative CSI levels began to stretch out from B.C.’s north and central coast regions toward the south.
By Thursday, Nov. 3, the prevailing temperatures across a wide coastal region of B.C. — stretching from Vancouver’s North Shore to the east coast of Vancouver Island and north to Prince Rupert — are expected to be 1.5 times less likely in the future.
What's next?
Not all extreme temperatures are the result of climate change.
La Niña and El Niño are used to describe warm and cool phases of a climate pattern that shifts across the tropical Pacific every three to seven years. As sea surface temperatures swing back and forth between Australia and South America, the cyclical El Niño Southern Oscillation (ENSO) phenomenon causes knock-on effects that disrupt temperature and precipitation patterns thousands of kilometres away — often in somewhat predictable ways.
In B.C., a cycle dominated by an El Niño pattern tends to lead to warmer winters, whereas a La Niña winter tends to be cooler.
For a third straight year, ENSO is forecast to swing in La Niña's favour, delivering a colder-than-usual winter to some parts of North America.
Last month, NOAA’s Climate Prediction Center said there is a 75 per cent chance of La Niña between December and February.
The National Oceanic and Atmospheric Administration said winter temperatures will dip up to 50 per cent below normal along a border region stretching from B.C. to the western reaches of the Great Lakes.
Precipitation, meanwhile, is expected to be 40 to 50 per cent above average across the border regions of B.C. and Alberta.
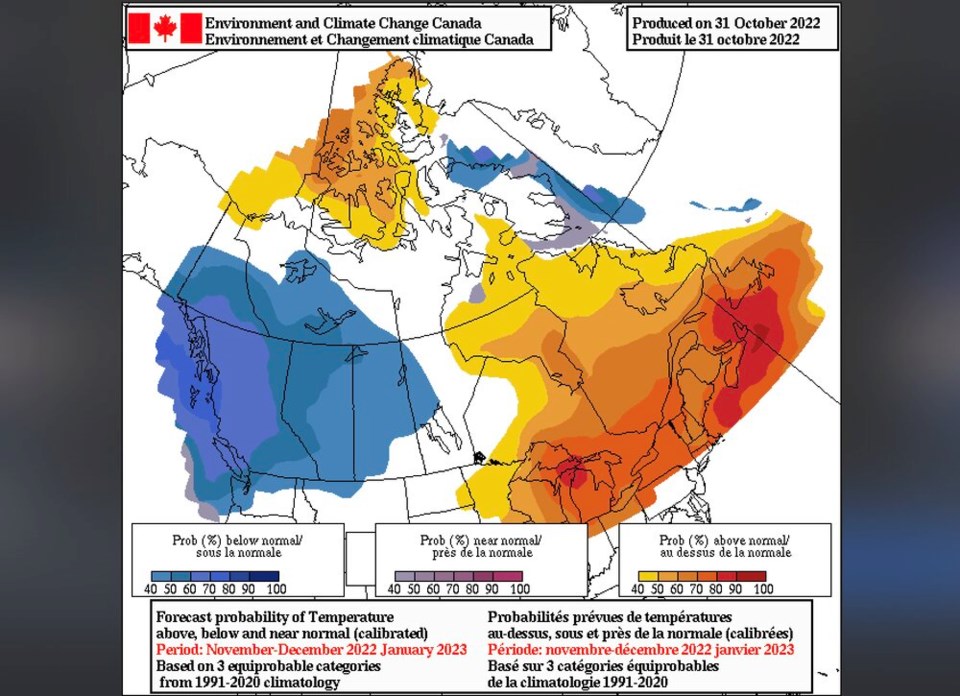
And its latest seasonal forecast, released Oct. 31, an ensemble of 20 Environment Canada climate models agreed, finding Western Canada is likely in for a colder-than-usual winter.
None of that is unexpected, said Gillett.
“We still expect variability in temperatures — day to day, month after month. Some months and days will be cooler than others,” said the scientist.
But the bottom line, he added: human-caused climate change will make those colder days increasingly less likely.
CORRECTION: A previous version of this article referenced weather in B.C. at times being made moderately to exceptionally worse due to climate change. In fact, the hot weather experienced during late September and much of October was made moderately to exceptionally more likely because of a changing climate.
EDITOR's NOTE: Comments from Climate Central scientist Daniel Gilford have been added to the original version of this story.

