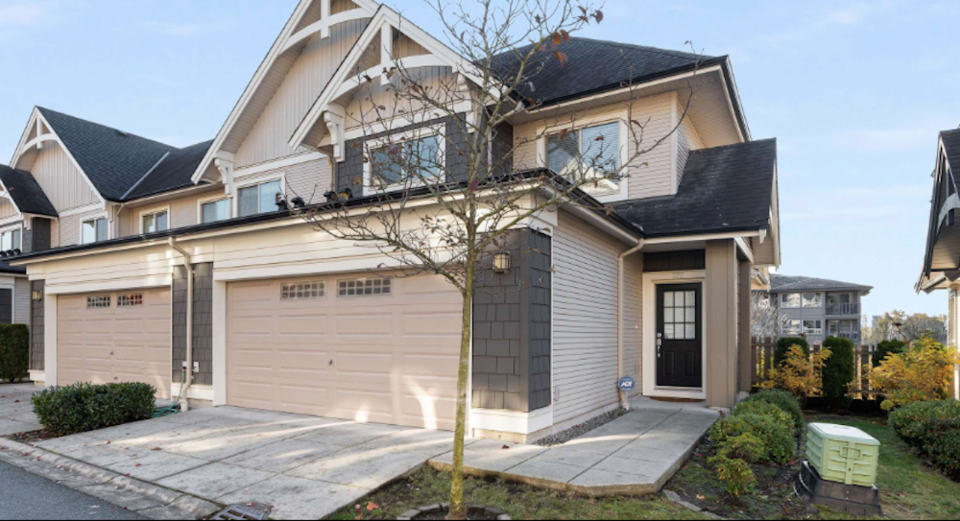
Tri-Cities was the region, Coquitlam was the place and attached homes were the hot ticket.
Sales for the form of local real estate jumped across the board for April, predominantly in Coquitlam by 39 per cent compared to March.
This contributed to an overall monthly rebound of 10 per cent for the Tri-Cities after 376 homes were sold, according to the latest report Real Estate Board of Greater Vancouver (REBGV).
This included 209 in Coquitlam, 91 in Port Moody/Belcarra and 76 in Port Coquitlam, equating to 75 per cent of the 501 available listings.
In March, 343 residences were claimed out of 539 listings (64 per cent).
Broken down, 43 attached Coquitlam homes were sold versus 31 in March, 24 in Port Moody/Belcarra (+14.3 per cent) and 15 in Port Coquitlam (+15 per cent).
Other popular buys for new property owners included 22 detached Port Moody/Belcarra homes, a jump of 46.7 per cent in April, and 41 Port Coquitlam apartments at 41.4 per cent.
Experts believe this jump in regional sales is signalling a comeback, taking the market back to levels not seen since last spring and prior to eight consecutive interest rate hikes.
"The fact we are seeing prices rising and sales rebounding this spring tells us home buyers are returning with confidence after a challenging year for our market, with mortgage rates roughly doubling," REBGV spokesperson Andrew Lis said in a news release.
"The latest MLS HPI data show home prices have increased about five per cent year-to-date, which already outpaces our forecast of one to two per cent by year-end. The year is far from over, however, and it remains to be seen if these price increases will be sustained into 2024."
Meanwhile, yearly sales dipped across all of Metro Vancouver.
The REBGV said there were 2,741 home sales in April — a 16.5 per cent drop from the 3,281 recorded sales during the same time period one year ago.
For more detailed information, you can visit the REBGV's website.
The following numbers show Tri-City benchmark prices, monthly and yearly changes as well as price index according to MLS Home Price Index data:
Residential
Coquitlam
- Benchmark price = $1,077,900
- Price Index = 335.5
- One-month = 1.1%
- Three-month = 3.4%
- Six-month = 0.4%
- One-year = -11.2%
- Three-year = 28.2%
- Five-year = 18%
- 10-year = 108.3%
Port Coquitlam
- Benchmark price = $927,100
- Price Index = 357.0
- One-month = 1.2%
- Three-month = 3.6%
- Six-month = 1.8%
- One-year = -10.5%
- Three-year = 39.9%
- Five-year = 30%
- 10-year = 142%
Port Moody
- Benchmark price = $1,100,400
- Price Index = 346.8
- One-month = -0.5%
- Three-month = 1.6%
- Six-month = -1.5%
- One-year = -10%
- Three-year = 34.1%
- Five-year = 24.3%
- 10-year = 135.4%
Single-family detached
Coquitlam
- Benchmark price = $1,747,900
- Price Index = 399.9
- One-month = 0.7%
- Three-month = -3.4%
- Six-month = -0.1%
- One-year = -10.9%
- Three-year = 37.4%
- Five-year = 30.5%
- 10-year = 143.5%
Port Coquitlam
- Benchmark price = $1,339,000
- Price Index = 378.5
- One-month = 2.2%
- Three-month = 4.7%
- Six-month = 2%
- One-year = -13%
- Three-year = 42.4%
- Five-year = 34.8%
- 10-year = 158.9%
Port Moody
- Benchmark price = $1,981,400
- Price Index = 375.2
- One-month = -1.8%
- Three-month = 0.3%
- Six-month = -2.4%
- One-year = -10.7%
- Three-year = 36.5%
- Five-year = 30.4%
- 10-year = 148.8%
Townhouses
Coquitlam
- Benchmark price = $1,037,600
- Price Index = 401.9
- One-month = 2.1%
- Three-month = 6.4%
- Six-month = 2.3%
- One-year = -9.7%
- Three-year = 37.8%
- Five-year = 30.4%
- 10-year = 166.2%
Port Coquitlam
- Benchmark price = $901,600
- Price Index = 361.1
- One-month = 0.4%
- Three-month = 2.6%
- Six-month = 1.1%
- One-year = -12.6%
- Three-year = 36.8%
- Five-year = 31.4%
- 10-year = 156.5%
Port Moody
- Benchmark price = $1,022,300
- Price Index = 388.1
- One-month = 1.5%
- Three-month = 2.5%
- Six-month = 0.1%
- One-year = -10.1%
- Three-year = 38%
- Five-year = 33.5%
- 10-year = 158.6%
Apartments
Coquitlam
- Benchmark price = $675,300
- Price Index = 383.0
- One-month = 1.5%
- Three-month = 2.9%
- Six-month = 1.5%
- One-year = -6.6%
- Three-year = 19%
- Five-year = 16.4%
- 10-year = 144.6%
Port Coquitlam
- Benchmark price = $625,300
- Price Index = 425.1
- One-month = 1.6%
- Three-month = 3.3%
- Six-month = 2.5%
- One-year = -5.2%
- Three-year = 34.1%
- Five-year = 27.1%
- 10-year = 171.8%
Port Moody
- Benchmark price = $706,800
- Price Index = 376.8
- One-month = 1%
- Three-month = 4.4%
- Six-month = 1.1%
- One-year = -6.4%
- Three-year = 19.5%
- Five-year = 16.5%
- 10-year = 139.2%


.jpg;w=120;h=80;mode=crop)

