
Have you ever wanted to know the exact location, height, species, and diameter of every single sidewalk tree in Vancouver? Well you’re in luck.
Found on the City of Vancouver’s website the street tree dataset includes detailed information on the 151,238 trees found on sidewalks and boulevards across the city. Data provided includes the closest cross street and neighbourhood the tree can be found in and for those who need even more specifics most have their specific geographic coordinates included.
The map is not entirely all-encompassing, as park and private trees are not included, but it does refresh daily. However, tree attributes are generally not updated on a regular basis and it may be several years between updates.
“Priorities and resources determine how fast a change, in reality, is reflected in the data,” the city’s website states, explaining the coordinates were primarily provided by the 2016 Tree Inventory project.
Even still, the data allows anyone to see which are Vancouver’s most common and rare trees. One of the most familiar tree types is the Norway and Red Maple trees, commonly planted for their shady leaves. By far and away Vancouver’s most common trees include the Kwanzan Flowering Cherry tree with 10,388 planted across the city and the Pissard Plum adding another 8,276.
On the other end of the spectrum, the least common trees include the Willow Oak at 324 planted, the Black Locust at 316 and the Thornless Cockspur Hawthorne at 308.
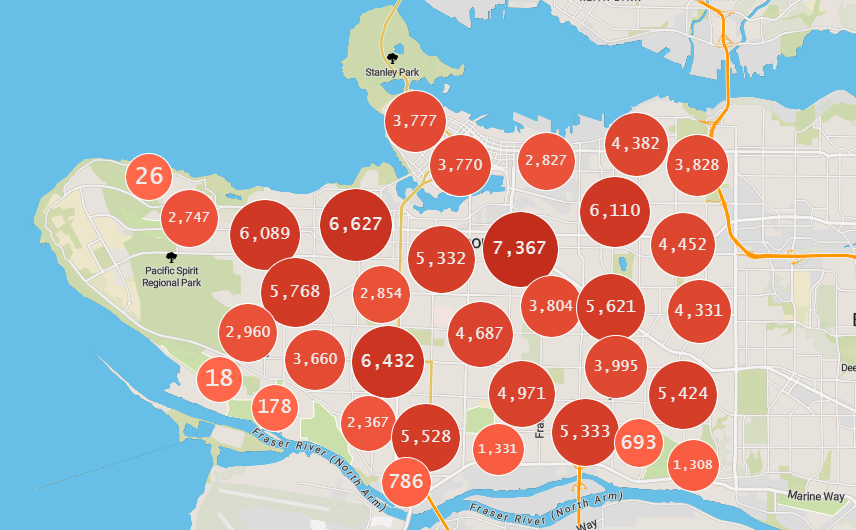
As far as where the most trees are planted, the Renfrew-Collingwood neighbourhood takes first place with 11,912 trees and Kensington-Cedar Cottage at a close second with 11,562. Hastings-Sunrise takes third place with 10,516.
The most sparsely-foliated areas in the city include the West End with just 3,573 trees planted. South Cambie is close behind with 3,505 and Strathcona in last with 2,686.
.png;w=960)
The data set also includes the dates when many of the trees were planted going back over 30 years. Since 1989 tree planting increased sharply, peaking in 1998 at 3,500. For the next 15 years, tree planting remained mostly constant around the 2,500 to 3,000 range until in 2013 the yearly tree planting rate went from 3,190 to 1,110 in 2014.


