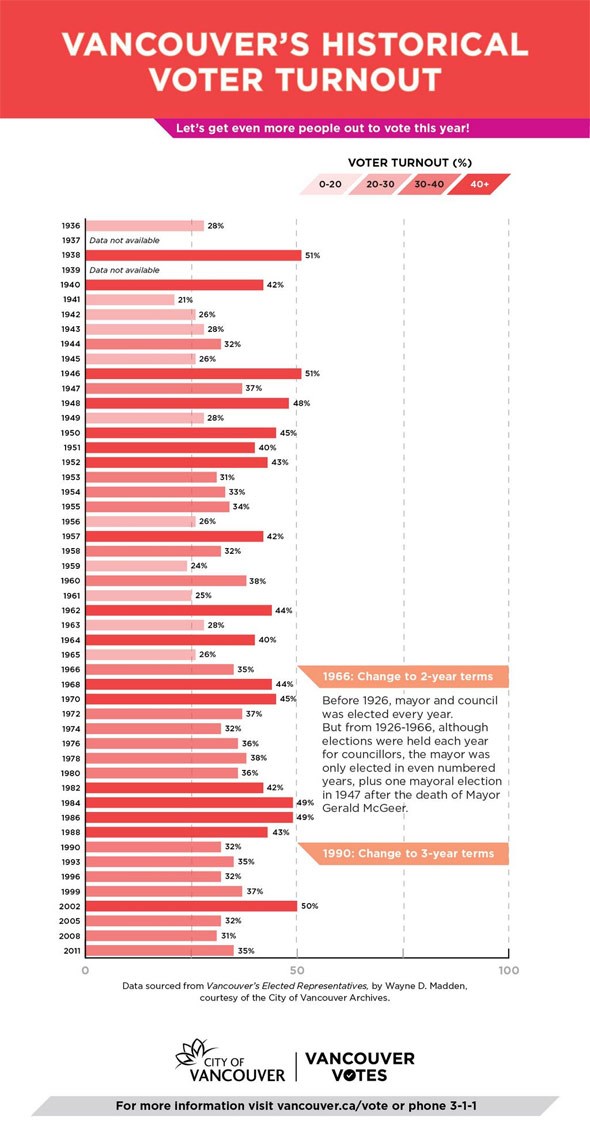
The City of Vancouver has been releasing some election-related infographics over the past couple of weeks and I found this one from today interesting enough to share. It shows the percentage of voters who turned up for our civic elections over the years and without proper dissection it's just a chart. 50% of voters turned out in 2002 to vote Larry Campbell in, and almost as many (49%) showed up in 1986 to vote Mike Harcourt out. The average voter turnout over the last 40 years has been 38% (it was 31% and 35% the last 2 times Mayor Gregor was elected in) and it seems to spike when people are really angry with the party in power, so it'll be interesting to see this chart after election day, November 15th, 2014 (register to vote HERE).
If you're looking for information about the election - real analysis and discussion beyond infographics and half-assed dissection of them (as I demonstrated above) - you should definitely follow/read Jeff Lee from the Sun, Charlie Smith from the Straight, Mike Howell from the Courier and Frances Bula from the Globe and Mail, and be sure to listen to Stephen Quinn on CBC's On the Coast Mon-Fri starting at 3PM on 88.1FM.